State-Owned Enterprises and Economic Development in Asia

Box 1.1: Soft-Budget Constraint and Implicit Subsidies
State-owned enterprises (SOEs) often enjoy implicit and explicit government guarantees for borrowing and preferential treatment to sustain their operations. Generally, these companies tend to have easy access to credit and capital injections, as well as various types of subsidies, which puts them at a clear advantage over private sector firms which generally do not have such privileges.
To perform a quantitative assessment of these preferential treatments, we compare SOEs’ actual profits vis-à-vis their “potential profits,” which is defined as the level of profits had these companies attained an “efficient” ROE*, i.e., the efficient risk-weighted cost of equity and basically the long-term average return on equity (ROE) for United States (US) and emerging market economies (PROSPERA unpublished). Typically ROE* turns out to be around 12%.
A finding that SOEs’ actual profits are higher than potential profits suggests that public enterprises are getting an undue advantage from the government, which would explain their higher profits relative to their private counterparts—this can be treated as an implicit surplus. On the other hand, lower actual profits relative to potential profits would suggest forgone profits or the existence of an implicit subsidy. Accordingly, the implicit subsidy/surplus can be calculated using the following equation:
Implicit Subsidy/Surplus = Profit – [Equity x ROE*]
The estimated implicit subsidy (if negative) or surplus (if positive) is based on an assumed ROE* of 12%—which is the 10-year average of ROE on the US stock market (through 2018) and approximately the long-term average ROE for overall emerging markets.a A persistently large and positive (surplus) would suggest that the advantages enjoyed by SOEs (such as state monopoly or cheap financing) outweigh the drags on performance (such as unremunerated public service obligations and governance issues). On the other hand, a largely negative subsidy reflects the amount of “forgone profits” and implies that SOEs are, on net, underperforming. The forgone profits could be considered implicit subsidies.
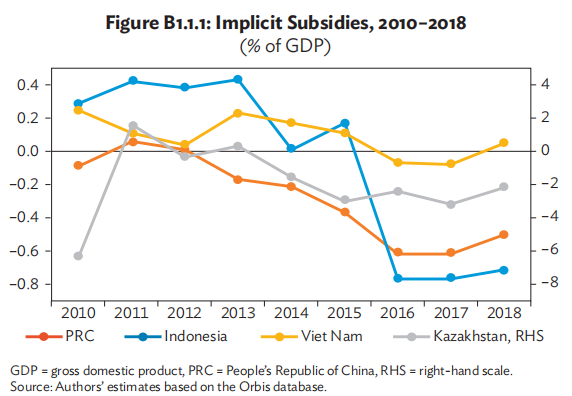
The following graph provides a comparison of implicit subsidy/surplus for different countries covering the period 2010–2018 (Figure B1.1.1).
In Figure B1.1.1, the horizontal line signifies that actual profits of SOEs are equal to potential profits. Positive deviations from the horizontal line imply an implicit surplus while negative deviations suggest an implicit subsidy. Although SOEs’ actual profits are cyclical in nature, for the purpose of analysis we are focusing on average implicit subsidy or surplus during 2010–2018.
The analysis suggests that in the People’s Republic of China the total amount of implicit subsidies during 2010–2018 was 2.5% of gross domestic product (GDP). Kazakhstan follows at 2.4% of GDP, and Indonesia at 0.6% of GDP. On the other hand, SOEs in Viet Nam during the same period had implicit surplus (1.0% of GDP), indicating state monopoly or cheap financing was made available to these companies.
a The US and emerging market ROEs are from the Damodaran NYU Stern database. http://pages.stern. nyu.edu/~adamodar/ (accessed 8 January 2018). Source: Authors.
1.6 Productivity and Efficiency Analysis
Improved productivity in providing goods and efficiency in delivering services remain the core issues of policy making in both developed and developing countries. Governments worldwide are increasingly under great pressure to upgrade the performance of the public sector and to identify best practices in delivering cost-effective public services.
Given the large presence of SOEs in some developing countries, there is considerable scope for these institutions to contribute to growth and efficiency. Since the public sector output makes up a substantial share of GDP in these countries, any effort to boost economy-wide productivity must also include measures to enhance the productivity and efficiency of these enterprises.
However, improving efficiency does not only mean reducing spending; it also encompasses the entire process of delivering public services in a more cost effective, efficient, and timely manner. Governments will need to rely on several factors—there is no single key driver— to increase the efficiency of the public sector and SOEs. The efficiency with which an enterprise utilizes its resources is affected by market and incentive structure (Jakob 2017). For example, there is ample room for enhancing the efficiency and quality of public service delivery by improving service design and by using markets and competition and new technology.
Since there is no one-size-fits-all formula to achieve efficiency, we draw valuable insights from the diverse approaches adopted by OECD economies since the early 1990s to introduce institutional reforms to the public sector. The main findings of the literature regarding public sector efficiency suggest that measures such as strengthening competitive pressures, transforming workforce structure, improving the size and skills of the workforce, and introducing results-oriented approaches to budgeting and management can be instrumental in enhancing SOE efficiency (Curristine, Lonti, and Joumard 2007).
In the subsequent section, we examine SOE productivity and efficiency by analyzing various measures, which provide valuable insights in understanding SOE underperformance and highlight the areas with significant scope for further improvement.