State-Owned Enterprises and Economic Development in Asia


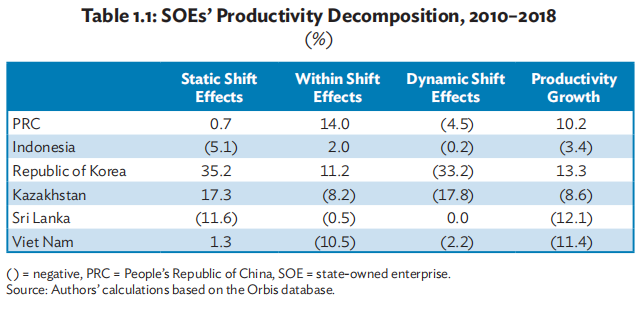
Productivity Analysis: First, we look at the results of sales per worker across countries. In this context, nominal sales of SOEs in each country are deflated by the respective index of GDP deflators (2010=100), giving us the series of real sales. In the second step, labor productivity is captured through the ratio of real sales to employment in different countries during 2010–2018 (Figure 1.5).
The analysis shows that productivity growth was highest in the Republic of Korea (13.3%) followed by the PRC (10.2%). In all other countries, labor productivity declined between 2010 and 2018. Changes in labor productivity can be attributed to either changes in labor productivity of the individual sectors or the structural shift in resources between contracting and expanding sectors. The results reveal that the growth in labor productivity mainly originated from productivity increases in individual sectors. On the other hand, the contribution of structural change, i.e., the movement of labor from low to high productivity sectors has remained limited (Table 1.1).
Efficiency Analysis: Governments across the world operate in an increasingly complex and unpredictable environment and are striving to improve access to and quality of public services while also ensuring value for money. Since SOEs are increasingly important actors in developing countries, more and more attention has been focused on the issue of SOEs performing efficiently. In the following section, we analyze various aspects of SOE efficiency.
Asset Turnover Ratio: To measure the efficiency with which SOEs in different sectors utilize their assets productively, we use the asset turnover ratio for the period 2010–2018. The asset turnover ratio measures the efficiency of a company’s assets to generate revenue or sales. It is equal to net sales divided by total or average assets of a company. Table 1.2 presents the average assets turnover ratio during 2010–2018 for different sectors. A company with high asset turnover ratio operates more efficiently compared with other firms in the same industry. Hence, a higher ratio indicates a more efficient use of assets, while a lower ratio indicates that the firm in that industry is not utilizing its assets efficiently. Industries with low profit margins tend to generate a higher ratio, and capital-intensive industries tend to report a lower ratio.
In the manufacturing sector, SOEs in the Republic of Korea have a higher assets turnover ratio (1.3) compared with similar firms in other countries. Companies engaged in providing construction, information and communication, public administration, and education services in the Republic of Korea also performed better during 2010–2018 compared with similar companies in other countries.
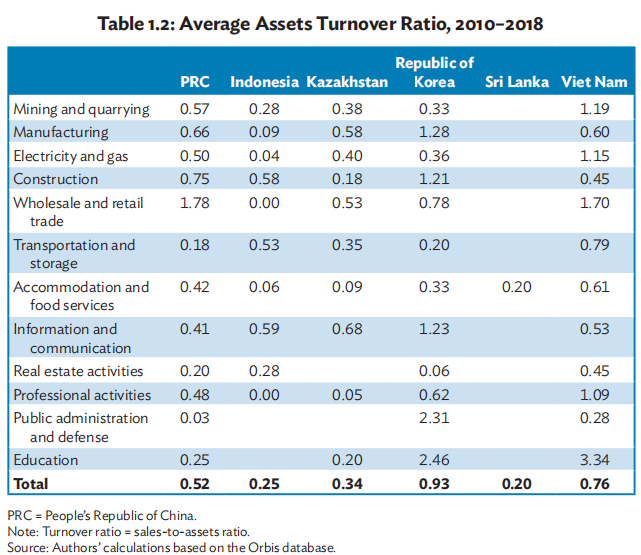
On the other hand, SOEs in wholesale and trade performed well in the PRC and Viet Nam and have higher asset turnover ratios. Likewise, SOEs in sectors such as mining and quarrying, electricity and gas, transportation and storage, and accommodation and food services performed better in Viet Nam. As discussed earlier, a lower ratio of companies in the same industry indicates poor efficiency, which may be due to poorly utilized fixed assets or relatively poor inventory management.
Allocative Efficiency of Capital: To analyze the allocative efficiency of the capital employed by SOEs, we use return on capital employed (ROCE), a ratio that captures the profitability and efficiency with which SOEs use their capital. ROCE is the operating profit or loss before tax as a share of capital employed. Hence, this measure basically captures the efficiency by which the sum of shareholders’ equity and debt are deployed to generate profits.
The analysis suggests wide disparity in the use of capital employed by SOEs in different sectors. For example, average ROCE during 2010–2018 ranges from 0.8% in financial and insurance activities to 11.8% in mining and quarrying sector. Prominent sectors with relatively higher ROCE are manufacturing (9.5%), electricity and gas (9.2%), construction (8.9%), information and communication (9.9%), and professional and administrative services (7.1%). On the other hand, SOEs operating in water supply and sewerage, accommodation and food services, and financial and insurance services have lower ROCE, implying less efficient use of capital (Figure 1.6)

Allocative Efficiency of Labor: Next, we analyze the allocative efficiency of labor employed by SOEs in different countries and compare it with private firms. Allocative efficiency of labor captures how efficiently SOEs and private firms allocate labor for different activities. We basically compare the average cost of labor per capita in SOEs vis-à-vis private enterprises. The average cost of labor includes basic salary, taxes, benefits, allowances, contributions, and other perks and bonuses of all employees including top management. The analysis reveals that in general allocative efficiency of labor for SOEs across our sample countries is lower than their private counterparts. On average, cost of labor per capita in SOEs has remained higher than in the private firms (Figure 1.7).
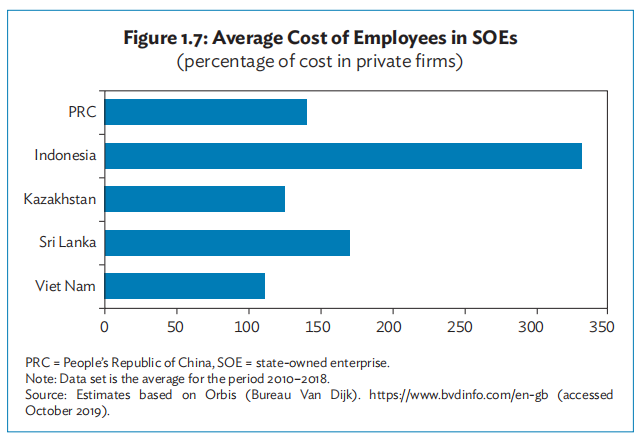
While SOEs incur larger labor costs than private firms in all countries, the difference is more pronounced in the PRC, Indonesia, and Sri Lanka where average cost of labor per capita is significantly higher than in private firms. On the other hand, in the case of Viet Nam, cost of labor is marginally higher than their private counterparts.
1.7 Return on Equity and Profitability
In this section, we examine the return on equity (ROE) and profitability of SOEs. A comparison of ROEs indicates that on average SOEs lag behind private firms in profitability, which implies that SOEs have not succeeded in generating profits from the money shareholders invested. The analysis shows that generally the rate of return for private firms is higher than public companies (Figure 1.8).

In the Republic of Korea, the ROE of private firms is substantially higher than that of SOEs. The average ROE during 2010–2018 for private firms was 8.6% compared with 3.5% for SOEs. A similar trend is observed in other Asian countries except for Viet Nam and Indonesia where the ROE of SOEs is higher than that of private firms. It is important to note that in most countries, SOEs are often privileged to have access to credit and receive various types of government subsidies, which precludes a level playing field for private firms.