State-Owned Enterprises and Economic Development in Asia

Hence, the higher ROEs of SOEs do not necessarily reflect good performance but may be a result of the advantages given to them by the government. Next, we compare the ROE for SOEs and private listed companies across different sectors and countries. For this purpose, we compute the percentage point differences between the ROEs of SOEs and private companies (Table 1.3).
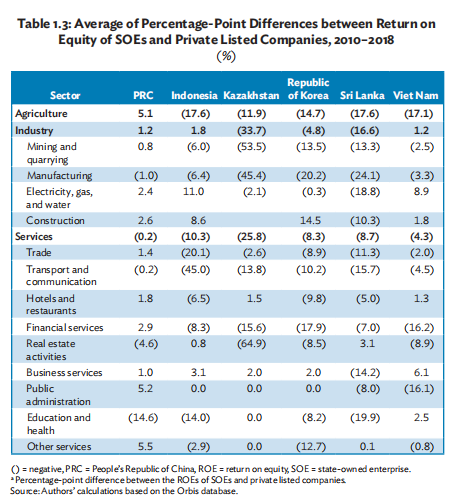
Generally, the analysis shows that SOE profitability is significantly lower than privately owned firms in similar sectors. For example, the ROE of SOEs in the agriculture sector is about 17.1 percentage points lower than privately owned firms in Viet Nam. Similarly, SOEs in other countries have shown varying degrees of underperformance. SOE underperformance is more pronounced in Kazakhstan where the industry sector ROE is about 33.7 percentage points and the services sector is 25.8 percentage points lower than private companies. However, services sector firms in the PRC have smaller differences in their ROEs relative to private enterprises. The analysis corroborates the viewpoint that generally SOE performance and efficiency lag behind their private counterparts. As discussed, SOE underperformance can be partly attributed to the government’s provision of soft budget constraint and various types of subsidies which do not incentivize SOE management to work in a competitive environment. On the contrary, private enterprises often operate in a competitive market which helps improve their efficiency.
Next, we analyze the earnings before interest and taxes (EBIT) margin of SOEs. EBIT is operating earnings over operating sales, which enables entrepreneurs to understand the true costs of running their company. Lower EBIT margins indicate lower profitability, which could either be an outcome of the competitive landscape in which case all firms in an industry have lower profits or the result of lower sales and higher costs. Since taxes vary by location and are not part of day-to-day core operations, using EBIT allows the comparison of companies on a level playing field.
Table 1.4 provides sector-wise EBIT margins for different countries. For example, in the Republic of Korea, the EBIT margin is higher in construction, business services, and public utilities. Comparison across countries reveals that in financial services, real estate, public administration, and other services, EBIT is much higher in the PRC than in other countries.

1.8 Quality of Output
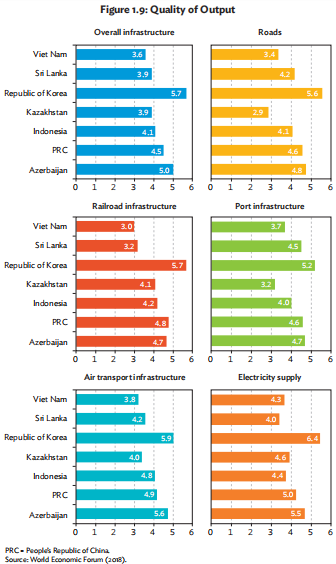
This section evaluates the quality of output and public service delivery of SOEs across countries. In the absence of detailed data on SOEs’ quality of output, we use infrastructure data. Additionally, since most SOEs are engaged in providing various infrastructure-related services, a comparison of infrastructure ranking across countries could provide some insight into the quality of the SOEs’ output (Figure 1.9).
Figure 1.9 shows that in all aspects of infrastructure development, the Republic of Korea outperformed other countries. The higher quality of infrastructure could also indicate good performance of the public enterprises providing these services, which may partly explain the Republic of Korea’s higher economywide productivity compared with other countries. One way to enhance output quality is to galvanize SOEs by promoting competition among public and private companies.
The evidence corroborates the view that competition is more important than ownership—in the 1980s for example, the Republic of Korea succeeded in improving quality of services by increasing competition among companies. In this context, the government set up a new state-owned telecommunication company which competed with existing SOEs in providing international call services, thus enhancing the quality of services. Competition could also be increased by liberalizing a sector dominated by private enterprises and letting it compete with SOEs that are supplying a partial substitute.
For example, in the United Kingdom, following the liberalization of bus services in the 1980s, the government allowed bus services to compete with the state owned rail company thereby enhancing the quality of public services. Another way to promote competition is to push SOEs to export and compete internationally and domestically, like the Republic of Korea did with the Pohang Iron and Steel Company (POSCO) in the 1970s. The company started production in 1973 and by the mid-1980s, it was considered one of the most cost-efficient producers of low-grade steel in the world (Chang 2013).
1.9 Public Asset Management and Macroeconomic Risks
In many developing countries, large deficits and contingent liabilities of SOEs are major reasons for high and rising government deficits. The global financial crisis was a painful reminder to governments to not only improve the effectiveness of SOEs but also to maintain ample fiscal space for applying an effective fiscal stimulus. As SOEs contribute significantly to economic development in emerging markets, their poor performance especially as they incur heavy losses, poses substantial macroeconomic risks to fiscal policy and financial stability. In some countries, SOEs have accumulated large amounts of debt particularly in the energy and transport sectors. Large debt and rising contingent liability along with a poorly regulated banking sector can potentially destabilize the finance sector, with negative spillovers likely affecting overall economic performance.
The quality of public asset management is one of the crucial building blocks that divide well-run countries from poorly governed countries. Better management is not just about financial returns, but other important social gains as well. It is worth emphasizing that a systematic assessment of the public sector’s assets across countries can increase transparency and accountability and provide valuable insights into their evolution over time (Detter and Folster 2015).